Summary
- In a world starved of workers and growth, we believe that Asia’s ability to supply both puts the region on a very firm footing over the longer term. Once we get through this current US-led rate tightening cycle and the flush out of weaker financial institutions in the West, we see a bright future for Asia, which is now trading at attractive valuations.
- In April, the MSCI AC Asia ex Japan Index fell 2.1% in US dollar terms. Asian markets generally traded cautiously in a narrow range during the month as investors continued to gauge the health of the global economy as well as corporate earnings.
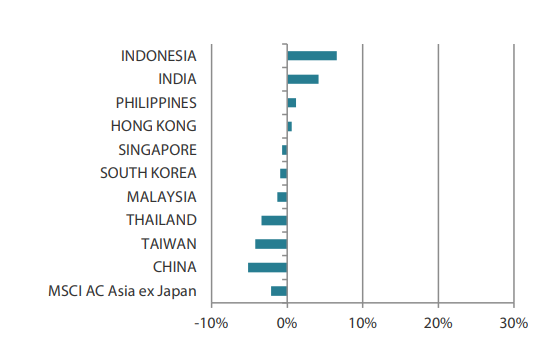
- In North Asia, China (-5.2%) and Taiwan (-4.2%) led the losses, whereas Hong Kong (+0.6%) rose marginally and South Korea (-0.9%) slipped. In ASEAN, Indonesia (+6.6%) and the Philippines (+1.2%) outperformed, while Singapore (-0.7%), Malaysia(-1.3%) and Thailand (-3.4%) all fell. Elsewhere, India (+4.2%) rose sharply.
- For China, we retain a positive view on areas of consumption, in particular local brand leaders, and on areas of healthcare, software and select industrials. We hold a favourable view of high-quality banks and companies leveraged to domestic consumption in India and Indonesia.
Market review
Asian markets slip on concerns about the global economy
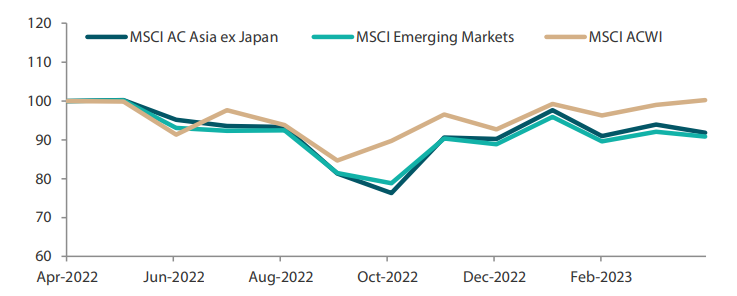
Regional equities lost momentum and slipped in April, with the MSCI AC Asia ex Japan Index returning -2.1% in US dollar (USD) terms. Asian markets generally traded cautiously in a narrow range during the month as investors continued to gauge the health of the global economy as well as corporate earnings. Data showed that annual inflation in the US eased in March, as compared to the previous month. Meanwhile, the US economy expanded at a mere 1.1% annualised rate in the first quarter of 2023 (1Q23), falling short of expectations.
Chart 1: 1-yr market performance of MSCI AC Asia ex Japan vs. Emerging Markets vs. All Country World Index
Source: Bloomberg, 30 April 2023. Returns are in USD. Past performance is not necessarily indicative of future performance.
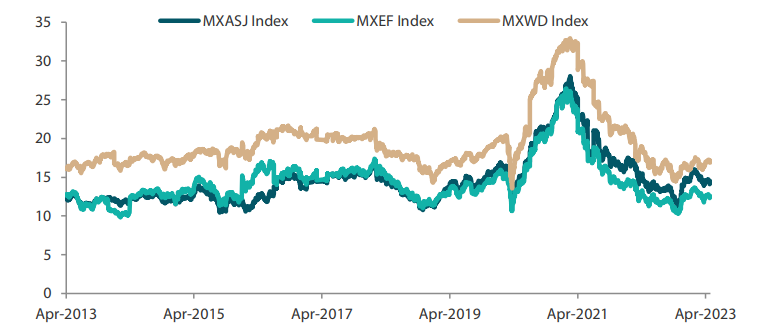
Chart 2: MSCI AC Asia ex Japan vs. Emerging Markets vs. All Country World Index price-to-earnings
Source: Bloomberg, 30 April 2023. Returns are in USD. Past performance is not necessarily indicative of future performance.
China and Taiwan lead the losses in North Asia
In North Asia, China stocks tumbled 5.2% in April amid growing concerns over the uneven pace of the economic recovery in the world’s second largest economy. Persistent US-China tensions as well as a correction in Chinese artificial intelligence and technology stocks, which were surging in recent months, also weighed down the Chinese equity market. The Chinese economy advanced 4.5% on a year on year (YoY) basis in 1Q23, accelerating from a 2.9% YoY growth in 4Q22, spurred by the country’s post-pandemic recovery. But some investors appear to have doubts over whether China can sustain its rebound.
Plunging 4.2%, Taiwan was another hard-hit market in April, weighed down by dismal export numbers and a slump in the shares of index heavyweight Taiwan Semiconductor Manufacturing Company, which recently downgraded its 2023 revenue outlook on weak demand and chip surplus. Taiwanese exports, hampered by the weak global demand, plunged 19.1% YoY to USD 35.2 billion in March.
Any reference to a particular security is purely for illustrative purpose only and does not constitute a recommendation to buy, sell or hold any security. Nor should it be relied upon as financial advice in any way.
South Korean stocks fell 0.9% as concerns about the country’s slowing domestic economy gathered pace. South Korea’s economy expanded 0.8% YoY in 1Q23, down from 1.3% in 4Q22. Index heavyweight Samsung Electronics reported that its chip division suffered losses of South Korean won 4.58 trillion in 1Q23, driven by a chip glut from weak demand for tech devices.
Bucking the downtrend in North Asia, Hong Kong stocks (+0.6%) were up marginally for the month. Annual inflation rate in Hong Kong was unchanged at 1.7% in March 2023, remaining at its lowest level since May 2022.
ASEAN markets turn in mixed performance; Indonesia outperforms
The ASEAN region’s equity market returns were mixed in April. Indonesia (+6.6%)—Asia’s best performing market for the month—led the gains. The Philippines (+1.2%) saw moderate returns, while Thailand (-3.4%), Malaysia (-1.3%) and Singapore (-0.7%) turned in losses.
Indonesia’s annual inflation slowed to a seven-month low in March. Bank Indonesia in April left its policy rate unchanged at 5.75% for a third consecutive meeting. Likewise, the rise in the annual consumer price index rates of Malaysia, Thailand and the Philippines moderated in March, coming in at 3.4%, 2.8% and 7.6%, respectively. The Philippines maintained its GDP growth view of 6–7% for this year as it expects investments and consumption to withstand the impact of higher inflation. In Singapore, the Monetary Authority of Singapore maintained its monetary policy as it considers the growing risks confronting the economy. In 1Q23 the economy saw a quarterly contraction of 0.7% and a marginal growth of 0.1% YoY, according to advance estimates.
Indian equities register strong gains
Indian stocks advanced 4.2%, lifted by sustained inflows from foreign investors and a surprising pause in the Reserve Bank of India (RBI)’s rate hike policy. In an unexpected move in April, the RBI left its policy rate unchanged at 6.50%, breaking the cycle of six consecutive hikes since May 2022, while retaining its “withdrawal of accommodation” stance. Headline inflation in India eased to 5.66% YoY in March from February’s 6.44%, prompted in part as the rise in food and fuel pricesslowed. Meanwhile, both merchandise export and import growth saw a material contraction in March, and consequently, the trade deficit widened to USD 19.73 billion.
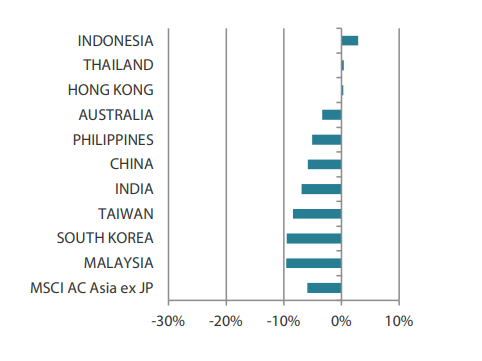
Chart 3: MSCI AC Asia ex Japan Index1
| For the month ending 30 April 2023 | For the year ending 30 April 2023 | |
|
|
Source: Bloomberg, 30 April 2023.
1Note: Equity returns refer to MSCI indices quoted in USD. Returns are based on historical prices. Past performance is not necessarily indicative of future performance.
Any reference to a particular security is purely for illustrative purpose only and does not constitute a recommendation to buy, sell or hold any security. Nor should it be relied upon as financial advice in any way.
Market outlook
Countries outside of China and the US headed towards a different economic cycle
With the US banking turmoil on the back-burner in April, global markets reflected the positive earnings results and talks of interest rates peaking sooner rather than later. However, economic data (particularly those of the purchasing managers’ index) out of China is coming in weaker, and cracks are starting to appear in the US commercial real estate market. Inflation, though persistent, is lower outside of the US and will likely decline faster. Countries outside of China and the US are showing that they are on a different economic cycle. And exposure to markets outside of China and technology are expected to continue to act as a buffer in these turbulent times.
Asia trading at attractive valuations
The regional banking and broader financial sectors remain insulated from the troubles in the US. Smaller scale rate hikes in Asia, prudent supervision by regional financial regulators, outsized capital adequacy ratios and sensible security exposure relative to total assets are reasons why we expect Asian banks to be more insulated from the current global banking turmoil. Longer term, in a world starved of workers and growth, Asia’s ability to supply both puts the region on a very firm footing. Once we get through this current US-led rate tightening cycle and the flush out of weaker financial institutions in the West, we see a bright future for the region. Asia is now trading at attractive valuations, with significant positive change that may lead to future sustainable returns.
Favouring consumption, healthcare, software and select industrials in China
Economic data out of China is showing signs of slowing down. Financial conditions remain supportive but lending for investment growth has not recovered. Consumers in China continue to spend and are supporting economic growth. The average Chinese household is still sitting on substantial excess savings accumulated during the pandemic. Further, after the annual Two Sessions meetings, policy visibility has improved with a new economics team officially taking over the helm, charged with responsibilities to restore growth and development. In the medium term, we expect China’s new Premier Li Qiang to adopt a policy approach characterised by pro-business pragmaticism. We retain a positive view on areas of consumption, in particular local brand leaders, and on areas of healthcare, software and select industrials.
Structural reforms boosting the appeal of India and Indonesia
The stars are now seemingly aligned for countries like India and Indonesia. Not only do they have the cheap excess workers needed by the world, but these workers are also more skilled than ever as a result of structural reforms boosting productivity. These reforms also have the effect of loosening bottlenecks on foreign domestic investments inflow, just as geopolitics in the form of “China Plus One”, which is now bringing businesses to their doorsteps. The aforementioned factors continue to drive our favourable view of high-quality banks and companies leveraged to domestic consumption in India and Indonesia.
Chart 4: MSCI AC Asia ex Japan price-to-earnings
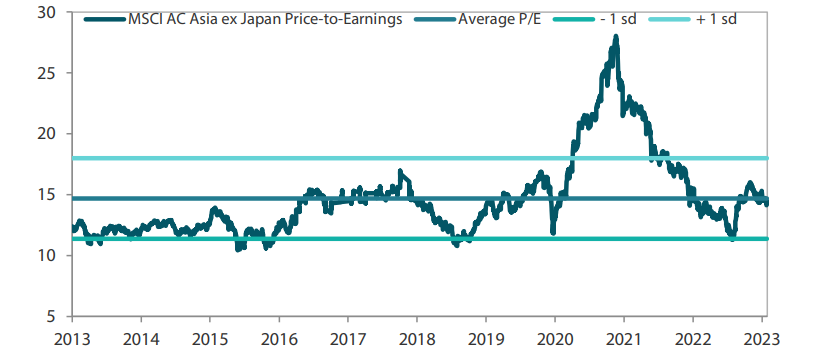
Source: Bloomberg, 31 March 2023. Ratios are computed in USD. The horizontal lines represent the average (the middle line) and one standard deviation on either side of this average for the period shown. Past performance is not necessarily indicative of future performance.
Chart 5: MSCI AC Asia ex Japan price-to-book
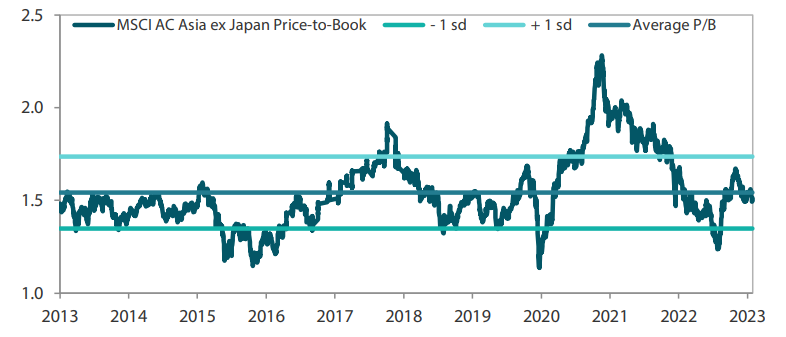
Source: Bloomberg, 30 April 2023. Ratios are computed in USD. The horizontal lines represent the average (the middle line) and one standard deviation on either side of this average for the period shown. Past performance is not necessarily indicative of future performance.


