Snapshot
Global markets rose amid optimism over progress in trade talks, which allayed fears of a tariffs-fuelled global economic slowdown. However, uncertainty still hangs over the markets. The UK became the first country to seal an agreement with US President Donald Trump since his “Liberation Day” tariff spree, while the US and China agreed to dramatically lower tariffs for 90 days. Then a federal trade court deemed Trump's new levies as illegal—although the ruling has since been temporarily put on hold. US stocks delivered their best month since late 2023, with the benchmark S&P 500 closing the month 6.2% higher, led by big tech stocks, encouraging inflation data and de-escalation of tariffs. US exceptionalism has faded from view recently, supporting an exodus from US assets. However, our stance remains that the US is core to our investment thesis, allowing us to stay invested in the secular growth trend in technology innovation not found elsewhere in the world. European stocks also rounded off the month with gains as Trump postponed the implementation of a 50% tariff on imports from the European Union to allow for more time for negotiations. In China, benchmark lending rates were cut by 10 basis points (bps) in a move to boost its economy. Overall, the MSCI All Country World Index climbed 5.5% in US dollar (USD) terms over the month.
US Treasuries (USTs) sold off in May, with yields climbing steadily through most of the month. The initial rise was triggered by a strong US April jobs report, which led markets to delay expectations for the next Federal Reserve (Fed) rate cut. Optimism surrounding trade developments—particularly the resumption of US-China negotiations and the finalisation of a US-UK trade deal—further lifted sentiment for growth and pushed yields higher. As anticipated, the Fed kept policy rates unchanged, with Fed Chair Jerome Powell reiterating a patient, data-dependent approach and offering little forward guidance. In the latter half of the month, fiscal concerns gained traction after the House advanced a budget plan projected to add as much as USD 5.2 trillion to the federal deficit over the next decade. Investor confidence was further undermined by Moody's downgrade of the US sovereign credit rating to “Aa1”, putting renewed upward pressure on yields. By the end of May, the benchmark 2-year and 10-year UST yields settled at 3.90% and 4.40%, respectively, 29 bps and 24 bps higher compared to end-April. Sovereign yields also rose in many other developed economies, and we will look at why European bonds look like a relatively attractive proposition when compared to their peers from countries such as the US and the UK.
Outside of general equity and fixed income markets, gold has climbed by more than a quarter so far this year but flatlined over May, as the market remained in a wait-and-see mode in response to tariff developments and signals regarding monetary policy. West Texas Intermediate crude oil prices jumped 4.4% in May, as the moves toward resolving trade disputes gave investors hope that economic disruptions from the US-led trade war may be avoided. However, the price of oil is still down year-to-date, under pressure as the Organization of the Petroleum Exporting Countries and its allies had pushed barrels back into a seemingly well-supplied market. Real estate, as measured by the FTSE NAREIT Global Real Estate Index, advanced 2.7%.
Cross asset 1
For the month of May, we increased our overweight to growth assets, while reducing our defensives marginally to a more modest overweight. We maintain our conviction that growth assets will continue to do well through the rest of the year despite the ongoing uncertainties surrounding the import tariffs. Corporate earnings, especially in the US, have held up well in the last quarter and the impact of import tariffs has been subdued so far but the lagged impact will likely be felt in the coming earnings season. We are of the view that the market has expected far too worse an outcome and incrementally, news flow could be positive with a number of trade deals likely to be announced, lending support to our belief that Trump is using import tariffs as a negotiating tool rather than initiating trade wars with the rest of the world. We are also expecting the US tax bill to be passed in the coming weeks, which should be positive for risk assets. Outside of the US, we still view the rate-cutting cycle favourably, and this could help offset some of the slower economic growth that we are seeing. For defensives, we have reduced our score marginally for the asset class as a whole as we have become a little more positive on our outlook for growth.
Within growth assets, we maintained our overweight in DM equities and emerging market (EM) equities. Within DM, we increased our overweight in the US on the back of better visibility on earnings growth and likely Fed cuts in the second half of the year. As a result, we increased our underweight on the UK and Australia. We maintained our neutral position in Japan on expectations of the yen weakening on the Bank of Japan (BOJ)'s shift to a less hawkish tone. The longer-term structural story of improving corporate governance and earnings growth momentum in Japan remains intact. Likewise, we maintained our neutral position on Europe with the expectations that the region's corporate earnings should turn positive in the latter half of the year with the European Central Bank (ECB) cutting rates more aggressively than the Fed. The weakening of the euro from hereon may also be positive for Europe. We continue to like Singapore for their attractive dividend yields and resilient economy. Within EM, we continue to favour selective countries—like India—which are expected to benefit from domestically-driven economies and structural long-term growth stories. Likewise, we retained our overweight position in Taiwan, which is a beneficiary of the current global tech upcycle. We maintained our neutral position in commodities given its attractive valuation and for diversification purposes. The asset class continues to generate strong free cash flow and has good dividend yields. We maintained our underweights in REITs and infrastructure, as we see better risk rewards in other asset classes.
Regarding defensives, we downgraded our score slightly, reflecting the marginally stronger outlook for growth due to abating tariff uncertainty, and the potential fiscal effects that are to come from the US government cutting taxes. We downgraded our DM sovereign score to reflect this, as the Fed appears likely to lower the policy rate to a 3.50-4.0% range over the coming twelve months, which, when paired with a large fiscal deficit, could see USTs rise. Outside of the US, we still like Australian government bonds as the Reserve Bank of Australia (RBA) is now in a rate-cutting cycle, and countries like France where hedged yields remain strong. Through the month, credit spreads have continued to perform well, and spreads are at relatively tight levels once again. For investment grade (IG) credit, we reduced the score marginally, allocating towards high yield (HY) instead. For spreads, while they optically look tight, the duration of the High Yield Index is falling, and this means the spread divided by duration is actually at average levels. Should economic growth come with rate cuts outside of the US, we expect this to support spread compression and lead to more outperformance from HY.
1 The Multi Asset team's cross-asset views are expressed at three different levels: (1) growth versus defensive, (2) cross asset within growth and defensive assets, and (3) relative asset views within each asset class. These levels describe our research and intuition that asset classes behave similarly or disparately in predictable ways, such that cross-asset scoring makes sense and ultimately leads to more deliberate and robust portfolio construction.
Asset Class Hierarchy (Team View 2 )

2 The asset classes or sectors mentioned herein are a reflection of the portfolio manager's current view of the investment strategies taken on behalf of the portfolio managed. The research framework is divided into 3 levels of analysis. The scores presented reflect the team's view of each asset relative to others in its asset class. Scores within each asset class will average to neutral, with the exception of Commodity. These comments should not be constituted as an investment research or recommendation advice. Any prediction, projection or forecast on sectors, the economy and/or the market trends is not necessarily indicative of their future state or likely performances.
Research views
Growth assets
Growth assets remain appealing, as we believe that global economic growth will stay resilient despite the ongoing uncertainties due to the status of the US import tariffs, which are currently under review by the US Supreme Court. Surprisingly, market sentiment remains negative despite incrementally good news on trade deals and tax cuts being passed in Congress. While US economic data have shown signs of weakening, they have not collapsed as initially feared. Inflation remains benign globally, providing room for central banks to implement supportive measures bolster economic growth. Corporate profits in the US continue to be strong and are being revised higher, while corporate earnings outside of the US are coming in softer than expected as the global economy slows.
Overall, earnings growth remains on an upward trajectory, providing support for growth assets. However, uncertainties persist due to ongoing trade tariffs discussions and legal challenges to the Trump administration. Clarity may emerge over the next few months as these uncertainties are resolved. In the short term, we note that potential positives could stem from corporate or income tax cuts and the Fed's rate cuts in the second half of the year which should be supportive of continued economic activities in the US.
Is US exceptionalism over?
We started the year with a prevailing consensus favouring US exceptionalism and overweighting the US. However, much of this optimism has faded, and concerns now linger over de-dollarisation, isolationism and the impact of tariffs. With the shift in sentiment, investors are now underweighting US assets and overweighting investments in other regions. That said, the US is still core to our investment thesis; given that the technology sector represents almost 30% of the S&P Index, investing in the US allows us to capitalise on the ongoing secular growth trend in technology innovation not found elsewhere in the world.
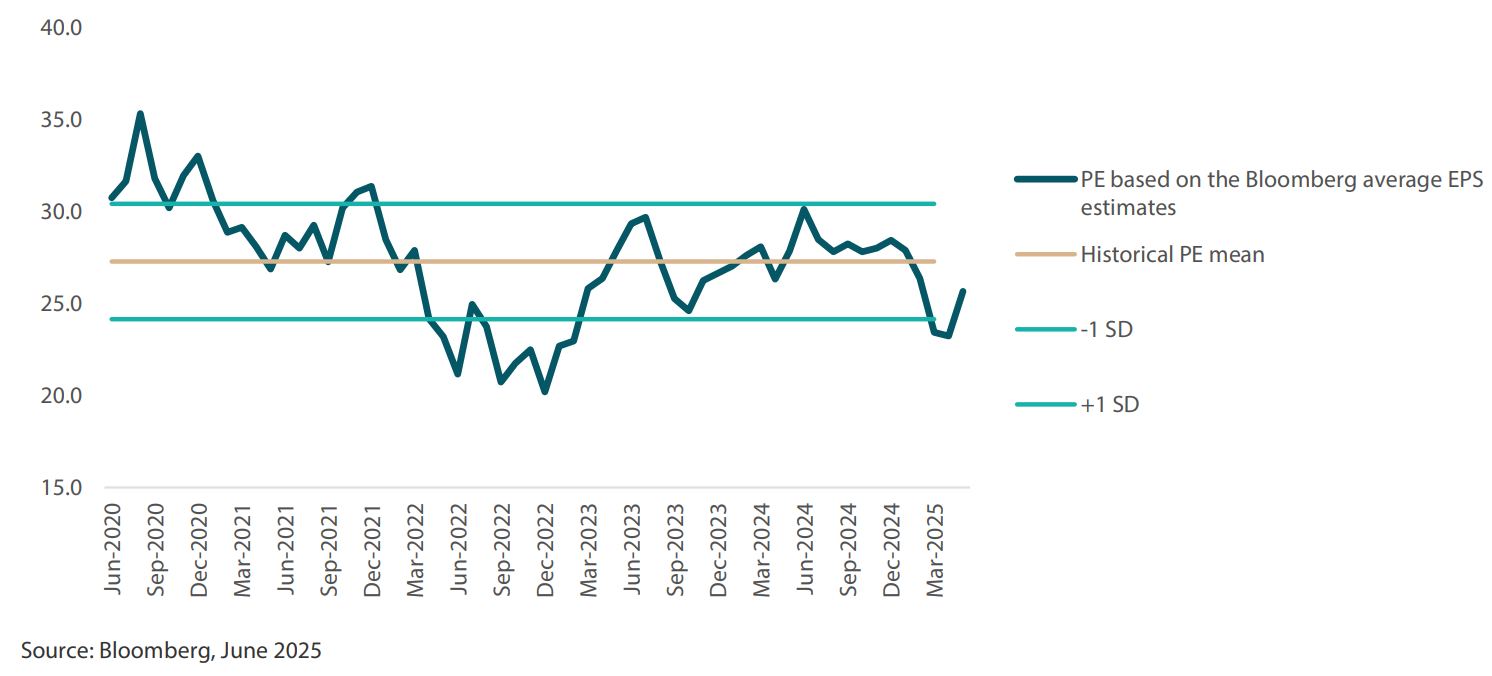
Following the pause in global tariffs in April, the price-earnings (PE) multiples of the S&P Index are now back to their previously elevated levels on an aggregate level. However, we believe that this does not necessarily reflect the underlying valuation of the bourse. When we look at valuation of companies from a bottom-up perspective, it tells a different story. For example, the "Magnificent 7” mega-tech companies are actually trading below their historical mean (see Chart 1). This can be attributed in part to the negative sentiment towards the technology sector and scepticism regarding the expected returns on the significant capital expenditure in artificial intelligence (AI). As a result, these mega-tech companies have not rallied as much compared to the other sectors.
Chart 1: Magnificent 7 valuations look attractive against their 5-year historical mean
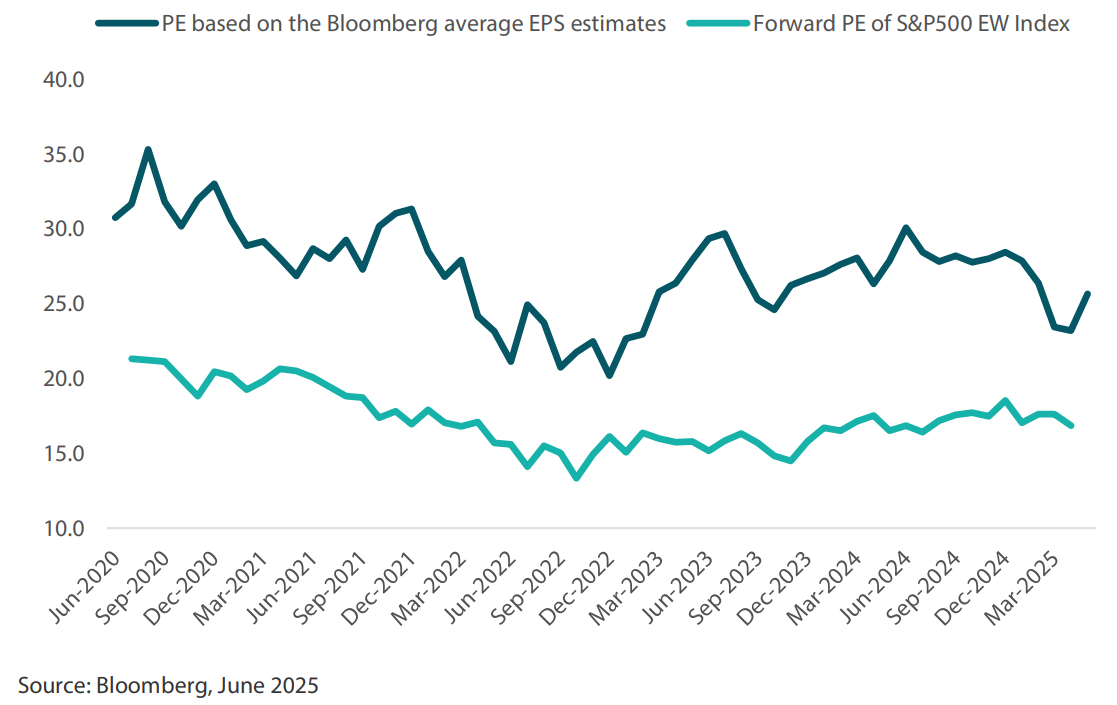
The mismatch between a top-down perspective and bottom-up analysis can be explained by sector weight changes over the years. The market capitalisation of the Magnificent 7 has been on the rise, leading to their weights increasing within the index. The technology sector has higher earnings growth and hence, trades at a higher PE multiple compared to the broader constituents of the index, such as the S&P Equal Weighted Index (see Chart 2). Consequently, as the weights of high-PE multiple sectors have expanded, the overall PE multiple of the US equities index has also risen. However, at the underlying individual stock level, PE multiples have traded roughly in line with their mean.
Chart 2: Magnificent 7 valuations higher than the Equal Weighted S&P due to higher earnings profile
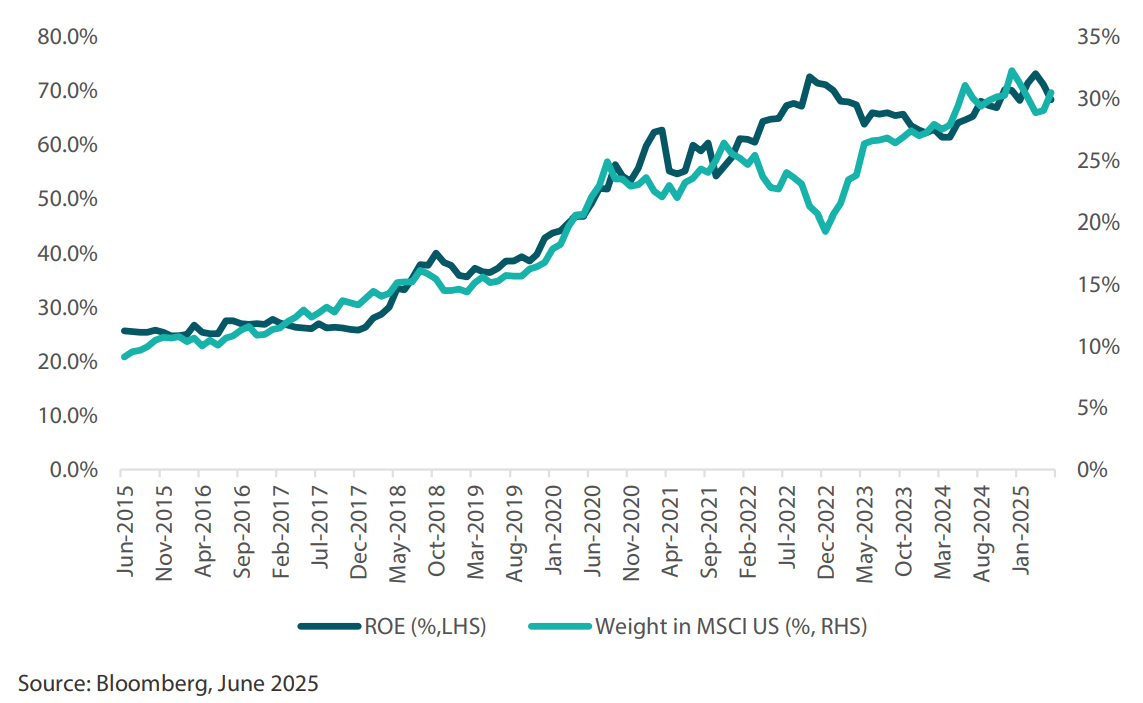
The correlation between the return on equities (ROE) of the Magnificent 7 and their corresponding increase in index weights over time is notable, as shown by the strong relationship depicted in Chart 3. If we expect the technology sector's ROEs to keep rising over the next few years, we could see the sector's weight within the index continue to increase, as strong earnings and high levels of profitability may keep driving performance. This upward trajectory in sector weight should support a higher ROE for the US equity index, which will then uphold the “higher for longer” valuation outlook.
Chart 3: Magnificent 7's increased weight in MSCI US justified by higher return on equities
Conviction views on growth assets
- Overweight exposure to US growth for now: We continue to like the US for its secular long-term earnings growth driven by technology and healthcare innovations. We are also positive on increasing energy demand from data centres with the significant AI capex outlay over the next few years. There remains potential for positive surprises in the market, such as responses from central banks and import tariffs relief. We see current US market valuations as attractive and are looking for catalysts that could drive further improvements.
- Overweight on Singapore: We still have an overweight position in Singapore due to its defensive attributes. Singapore offers high dividend yields and low beta. The market is also strong in terms of relative valuation metrics and are least likely to be targeted by Trump's tariffs policies, given Singapore's trade balance deficit position.
- Maintain our overweight exposure to EMs: Within EM, we prefer selective markets, such as India, which benefit from domestically driven economies and structural long-term growth stories.
- Neutral on commodity-linked equities: We continue to believe that commodity-linked equities will keep providing good diversification against inflation in the longer term. The fundamentals of the sector remain compelling due to both cyclical and secular factors.
Defensive assets
Defensive assets generally fell during May, as the risk-off tone from April subsided and bonds yields rose. For the month, 10-year UST yields rose 24 bps while 2-year USD yields climbed 29 bps. With markets now seeing some positive news on the tariff front, the extreme moves in interest rate pricing have returned to levels we consider more appropriate. For example, the market's forecast for the Federal Reserve policy rate in 12 months' time now sits at 3.70%, which remains in the 3.50-4.0% range that we have expected for some time. Outside of the US though, policy rate expectations remain far lower, with the RBA now expected to ease to 3% in 12 months' time. This could see significant policy rate reductions outside the US, with central banks such as the ECB, Bank of Canada and RBA taking rates away from restrictive levels. This month's Balancing Act looks at European yields, focusing on France, which now offers attractive hedged yield opportunities for Japanese investors. This opportunity comes after the yields, which were negative, started to rise after the market underwent a selloff in 2022.
France: attractive pickup
Since the snap elections called by French President Emmanuel Macron in the middle of 2024, French 10-year government bond yields have traded some 70-90 bps above their German counterparts. In our recent Dynamic Asset Allocation (DAA) scoring, this has seen France again upgraded in score, as falling ECB policy rates and stable 10-year yields have created a strong opportunity to pick up hedged yields. Within the eurozone, economic data suggests that the ECB will need to keep its policy rate low and potentially ease into the 1.50-2.0% range. This is because inflation currently sits at 1.9%, edging back closer to the ECB's 2% target, and as growth in the region continues to remain in the 1% range.
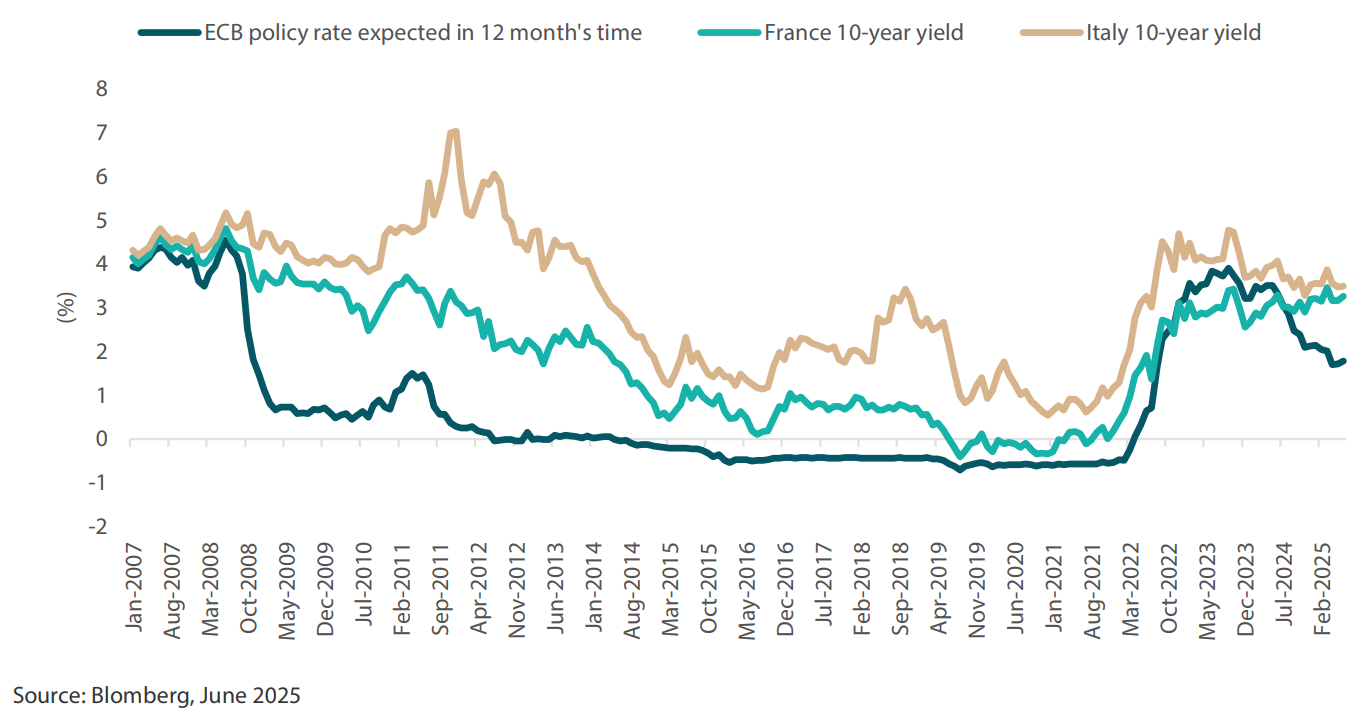
These economic conditions, coupled with easier monetary policy, have caused the French bond curve to steepen substantially. After being inverted from 2022 to 2024, the 10-year yield is now approximately 150 bps over the policy rate, which creates a far easier environment for bond portfolios to achieve positive returns. Additionally, while we had previously been overweight Italy in order to add additional yield into portfolios, the outperformance of Italy to France is now warranting a reduction in those positions. As can be seen in Chart 4 below, the Italian 10-year yield is only some 20 bps above that of France, and the spread is the tightest since 2008. The market views France negatively due to the political risks associated with the country. However, we think that France is now the better place to allocate as it retains an AA- rating despite political risks, while Italy's rating is still in the BBB range.
Chart 4: France and Italy 10-year government bond yields vs ECB policy rate expected in 12 months' time
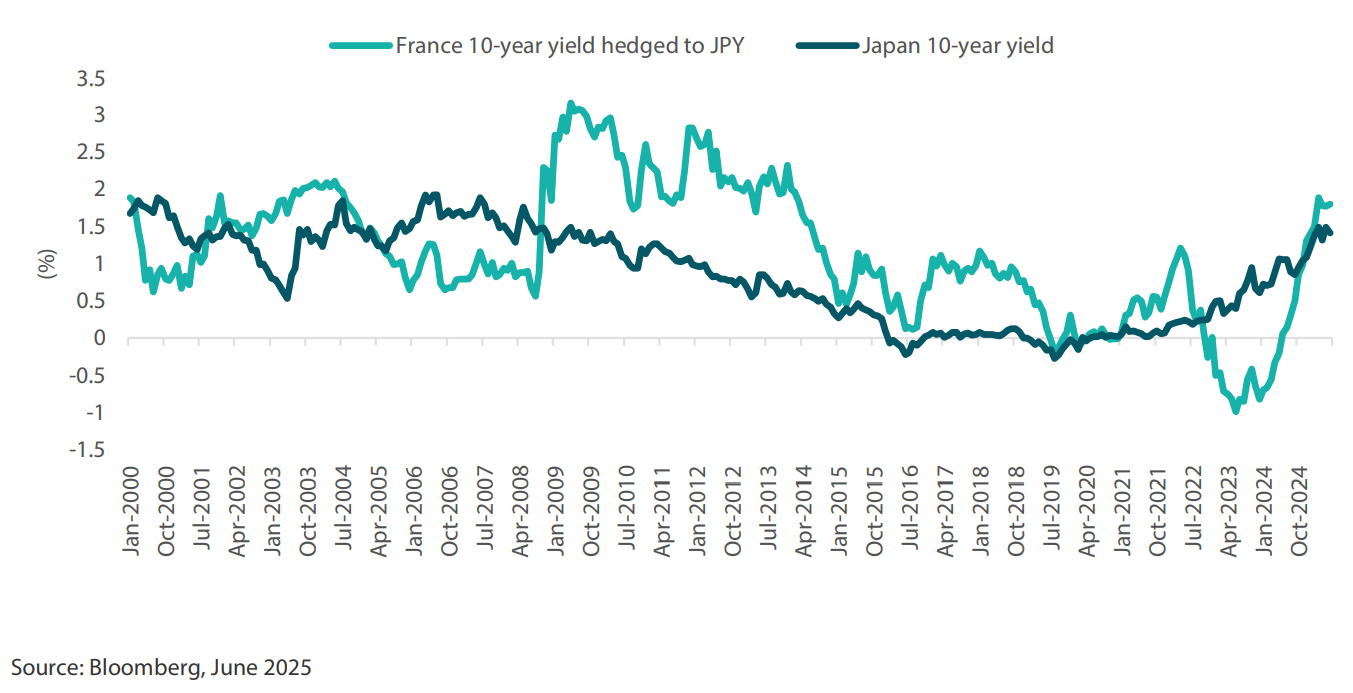
The implication for Japanese investors is that hedging French government bonds into Japanese yen (JPY) now offers strong levels of yield. With falling interest rates and stable yields, French government bonds offer Japanese investors over 180 bps of yield, the highest level since 2014, surpassing what can be achieved with Japanese government bonds. Given that Japanese investors buy large amounts of foreign bonds, this could begin to support global bond markets after an extended period during which Japan was associated with negative yields. For Singaporean investors, French government bonds hedged back into Singapore dollars yields over 3%, almost 100 bps higher than what Singaporean government bonds offer. The combination of strong yields and the potential for capital gains in the event of Europe experiencing a softer growth environment than expected makes owning European bonds a relatively attractive proposition when compared to countries such as the US and the UK.
Chart 5: 10-year French government bond yield hedged into JPY
Conviction views on defensive assets
- Still overweight IG credit allocations: Credit spreads sold off during the April turmoil, which opened up short-dated opportunities. We believe that deals are going to be made on trade and that tax cuts will soon be on their way, which will be supportive of credit spreads.
- Gold reaches expensive valuations: After favouring gold as a hedge for the past 18 months, the commodity's price has now risen to levels that make valuations look expensive. Compared to most asset classes, gold has outperformed and appears expensive against real assets such as housing and other commodities such as copper. While we like the idea of using gold for diversification, we listen to our process and have recently started to reduce our scores for what appears to be an expensive asset.
- Overweight duration in selective countries: While we expect the trade deals to be less impactful than the market expectations, central banks do not have this luxury. With the risk of growth slowing, a number of central banks should continue easing, including the ECB, BOE, RBA and the Fed. We like to use Australia as our overweight in duration as among the developed markets it has the largest link to China, and while trade deals could materialise for US allies, China will likely be singled out and face higher tariffs.
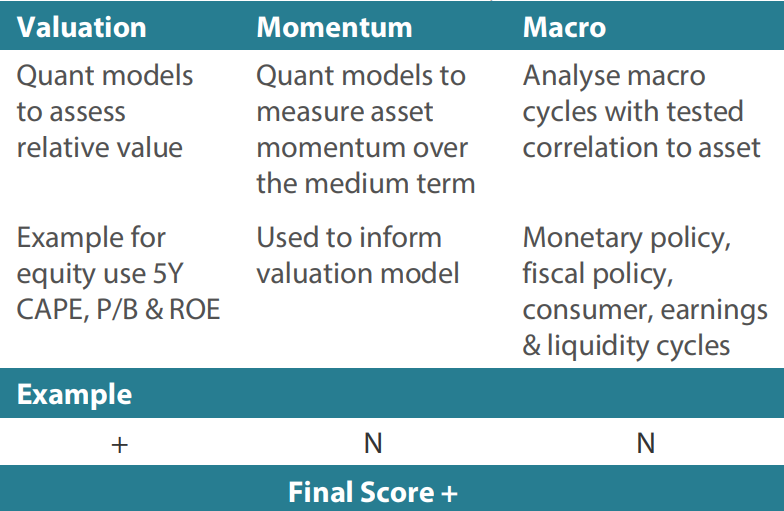
Process
In-house research to understand the key drivers of return: