


Snapshot
The global outlook still looks positive, but less is known about the potential impact of the latest variant of the COVID-19 virus, Omicron—particularly in light of the fast government response to add restrictions on travel and, in some cases, local mobility. Recent comments from Chairman Jerome Powell of the US Federal Reserve (Fed) also weighed on sentiment further, choosing to err on the side of being more hawkish in response to inflationary pressures rather than giving a more hopeful dovish tilt given the new variant concerns.
The primary risk may be the negative feedback loop between the governments’ reaction function and sentiment that ultimately feeds back into final demand. At the moment, the reaction function has been quite strong, which is not positive for the return of normal demand. The next several weeks will be critical for observing how the demand side of the equation ultimately works itself out.
We are optimistic but also cautious on final demand and global growth, simply because governments have acted aggressively to contain the latest variant and the Fed has not changed course to temper its plans to reduce easy policy. The darkest clouds have lifted for now as equities have clawed back losses from the sell-off that began in late November. Still, it remains important to watch how governments and policymakers respond to the Omicron variant.
Cross-asset1
While markets remain focused on the pace and extent of the removal of extraordinarily easy monetary policy, current policy itself remains very accommodative and supportive of the global recovery. Still, while recent news flow suggests that Omicron may be less concerning than the initial read by markets, winter is just beginning, and it is possible that new outbreaks could weigh on sentiment and final demand.
Governments appear to be reacting pre-emptively—that is to add back restrictions without any obvious threat, which could slow economic growth as we await further clarity on the danger at hand. We added protection in recent weeks, but then removed it based on the systematic elements of our process that were sounding an alarm based on elevated and increasing volatility.
We turned more cautious on defensive assets on the premise that developed market (DM) sovereigns look at greater risk of rising yields. Within growth assets, we made no changes, continuing to favour DM and emerging market (EM) equities over infrastructure and REITs. Within defensives, we prefer high yield and EM local currency bonds over investment grade (IG) and DM sovereigns. We have a neutral view on gold and defensive and growth currencies.
1The Multi Asset team’s cross-asset views are expressed at three different levels: (1) growth versus defensive, (2) cross asset within growth and defensive assets, and (3) relative asset views within each asset class. These levels describe our research and intuition that asset classes behave similarly or disparately in predictable ways, such that cross-asset scoring makes sense and ultimately leads to more deliberate and robust portfolio construction.
Asset Class Hierarchy (Team View1)
")
1The asset classes or sectors mentioned herein are a reflection of the portfolio manager’s current view of the investment strategies taken on behalf of the portfolio managed. The research framework is divided into 3 levels of analysis. The scores presented reflect the team’s view of each asset relative to others in its asset class. Scores within each asset class will average to neutral, with the exception of Commodity. These comments should not be constituted as an investment research or recommendation advice. Any prediction, projection or forecast on sectors, the economy and/or the market trends is not necessarily indicative of their future state or likely performances.
Research views
Growth assets
Generally, growth assets perform well until policy becomes tight. While policymakers are in the process of withdrawing extraordinarily easy policy, the adjustments to date are far from creating a tight policy environment outside a handful of emerging markets that have been much quicker to tighten in light of rising inflation pressures.
Still, the prospect for tighter policy often adds to market volatility. However, we believe that continuing to favour growth assets is sensible until policy is sufficiently tight to crimp global demand. Importantly, China is on a different course than most of the rest of the world—recently shifting toward easing to support domestic demand. Easing will remain limited given government efforts to reduce systemic risks, but the shift in policy is nonetheless positive for offering a lift to global demand.
Inflation is still a risk, whether it bites into profit margins or causes policymakers to accelerate their plans toward tightening. For now, margins have remained healthy while central bankers still show patience in dealing with inflationary pressures—some of which are expected to prove transitory. Of course, Omicron and government actions to slow its spread are a threat to global demand, but broad lockdowns are still unlikely as vaccination rates are high and the world is learning to live with the virus.
Respecting volatility
We ordinarily read economic data and events to form a view on the growth outlook, but sometimes we read the markets themselves to understand what we may be missing. In this respect, market volatility often speaks volumes and sometimes reveals hidden risks less apparent from common data. For this reason, we use models that interpret volatility as a systematic trigger for hedging portfolio risk.
In recent weeks, one of our models sounded a “risk off” alarm that might have been missed based on data alone. Yes, Omicron is a new variant that brings a host of unknowns—but not much differently than the Delta variant—and the Fed is sounding hawkish, but is this enough to suggest now is the time to reduce risk? Given that the world is learning to live with the virus, Omicron included, and policy is likely to stay easy for some time, fundamentals suggest risk should continue to be rewarded, but this month the model identified potentially deeper risks on the horizon worth hedging.
Markets themselves are full of head fakes, with pullbacks spooking the unsteady hand and rewarding those who ultimately stay the course. More than nine times out of 10, it pays to stay the course holding on to risk assets. However, market volatility itself includes contours of information not necessarily encapsulated in data or the daily news flow. We believe that models used to measure the structure of volatility offer a useful tool to determine when portfolio protection is most likely required.
We developed the “just in time” (JIT) hedging signal to identify potential “risk off” events. The central premise behind the model is that volatility tends to be more mean reverting than the markets they represent, which means that when volatility (measured by VIX) breaks normal patterns of risk—through a combination of increasing momentum, volatility of VIX itself or dislocations in term structure—the model can identify periods when reducing portfolio risk is advisable.
The JIT model generally does not recommend “expensive” protection, but when the volatility space warrants it, the model steps into a hedging position, which very occasionally steps up to a maximum “risk off” position that usually coincides with severe market turbulence. In late November, the model reached maximum risk off, which is only the tenth such occurrence over the last 15 years.
Chart 1: “Just in time” hedging signal – 10 maximum “risk off” events over 15 years
 Source: Nikko Asset Management Asia, December 2021
Yet, while US equities briefly sold off by approximately 4%, they have since reached new highs. This risk event was expensive in terms of hedging. However, on a net basis, it did not incur losses. This is a good result, but was it worth the cost of the hedge? We think so.
We may have seen a better result had the hedge not been applied, but more often than not, such hedges in a “max risk off” environment provide benefit by limiting downsides as they did in early 2020 when COVID-19 first struck.
In addition, while the signal has since turned off and hedges have been removed, it does not mean that the event is not important. Volatility shocks usually scar markets for some time, causing echo shocks, so we stay vigilant and ready to hedge risks that may resurface in the coming months.
Conviction views on growth assets
- Favour China: Policymakers finally eased, cutting the reserve requirement ratio to help stimulate the economy. As we have noted before, the government had signalled that the worst of the regulatory crackdown may be over, for now, while policy easing completes our bullish case for one of the worst performing markets over 2021.
- Modestly cautious on UK and Australia: As markets adjust to a less hawkish Bank of England and Reserve Bank of Australia than had been priced just a month ago, we see more potential downside for the financials-heavy indexes of the UK and Australia that tend to perform less well when central banks become less hawkish.
Defensive assets
We downgraded our already cautious view on defensive assets this month. Global bond volatility has risen to its highest point this year as investors contemplate the winding back of easy monetary conditions. The new COVID-19 variant has also added to uncertainty. However, in sticking to what we do know, most developed economies have high vaccination rates and monetary and fiscal policies that remain supportive, while economic recovery is well underway. Strong demand is pushing against supply constraints to create inflationary pressures that central banks will not be able to ignore much longer.
Within global credit, we continue to prefer high yield (HY) over IG credit. Interest rate volatility has been the primary driver of recent returns in IG. Credit quality is still strong and improving but rising global yields will continue to hold back returns in the more rate-sensitive IG sector. HY is more sensitive to changes in risk appetite, so our positive view on growth assets will be supportive. Having come through a very difficult pandemic period for HY issuers, only the strong have survived to take advantage of healthier conditions and default rates should remain low.
We have lifted our view on gold again to a more neutral outlook. US inflationary pressures continue to build and have become a political obstacle for the Biden administration. This has put the Fed in an awkward position as it seeks to maintain its dovish stance but is now under pressure to address inflation concerns. Should the Fed begin to tighten policy earlier than expected, real rates would likely rise, creating a headwind for gold prices. At the same time, high inflation could continue to support gold demand and potentially offset real rate concerns.
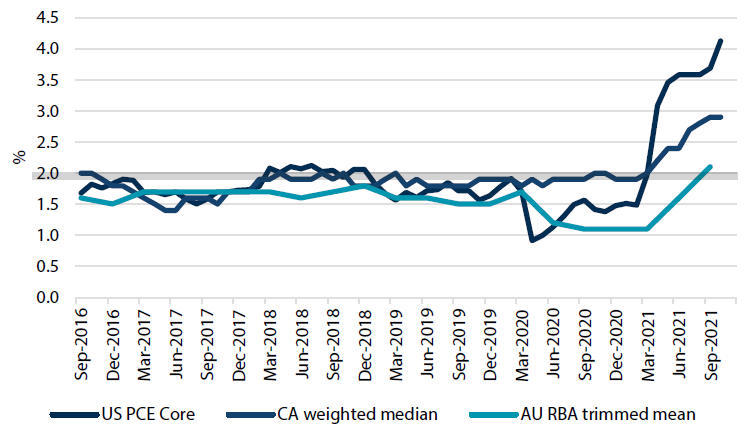
The response to the pandemic across various governments and central banks has undoubtedly been substantial. The fiscal and monetary policy tools deployed by developed countries have shared many similarities but have also varied by degree. Within the global economy, the dollar-bloc countries of the US, Canada and Australia have all largely followed the same playbook up to this point. However, some differences have appeared in the impact these policies are having on inflation. Chart 2 shows the recent core inflation outcomes in these three countries. While all three central banks can claim success in supporting their respective economies, one potential downside has been elevated inflation pressures not seen in many years.
Chart 2: Dollar-bloc core inflation
 Source: Bloomberg, December 2021
The US clearly stands out as having the highest core inflation, followed by Canada and then Australia. If we judge these annual inflation rates against the stated inflation target of 2% for these central banks, the US once again is the outlier with core inflation more than double the target. Australia, on the other hand, has only just returned to its target after missing it for several years prior. Translating these inflation outcomes to expectations about future monetary policy, one might reasonably expect the Fed to be first in line to lift cash rates but that doesn’t appear to be the case.
Chart 3 shows the market implied central bank cash rates in one month’s time through to three years from now. Somewhat surprisingly, the expected path for US rates over the next three years is the most gradual and stops at the lowest level. The Fed’s first hike is not expected until about June 2022 and then the rate peaks at 1.5% in 2023. The Bank of Canada’s path is the most aggressive, moving earliest and peaking highest above 2%. And finally, the Reserve Bank of Australia is expected to begin tightening last but then overtake the US and peak at just over 1.75%.
Chart 3: Market implied central bank rates
 Source: Bloomberg, December 2021
While there are many factors that figure into central bank deliberations on monetary policy, maintaining low and steady consumer prices is usually paramount. Looking through the inflation lens for the dollar-bloc economies, relative pricing of expected central bank actions seems inconsistent with actual inflation outcomes in these countries. These consistencies however can also be the source of opportunities for investors. In our view, US rates look too low relative to relative to both Australian and Canadian rates because of the disconnect between current inflation outcomes and market implied paths for central bank rates.
Conviction views on growth assets
- China bonds still favoured: China’s government bonds offer higher yields and lower volatility and gradual easing by the PBOC will provide additional support.
- Reduce exposure to dollar-bloc bonds: Markets are implying very gradual and shallow tightening cycles for dollar-bloc central banks. Stubborn inflation pressures are likely to require greater attention and a reassessment of the outlook towards a less benign outcome.
- TIPS to outperform: US inflation measures are expected to remain firm with annual measures yet to reach their peaks. We expect demand for inflation protection to remain strong, leading to outperformance of TIPS relative to nominal US Treasuries.
Process

