Summary
- Rising interest rates and inflation woes continued to weigh on regional and global markets. US consumer prices registered above expectations with the August consumer price index (CPI) jumping 8.3% year-on-year (YoY). The tight labour market made further case for a rate hike, culminating in a 75-basis-point (bps) interest rate hike by the US Federal Reserve (Fed).
- The MSCI AC Asia ex Japan Index lost 12.6% in US dollar (USD) terms in September. Asian markets were clouded by the negative sentiment from US, with all local markets turning in losses. USD strength against other currencies also impacted overall market performance.
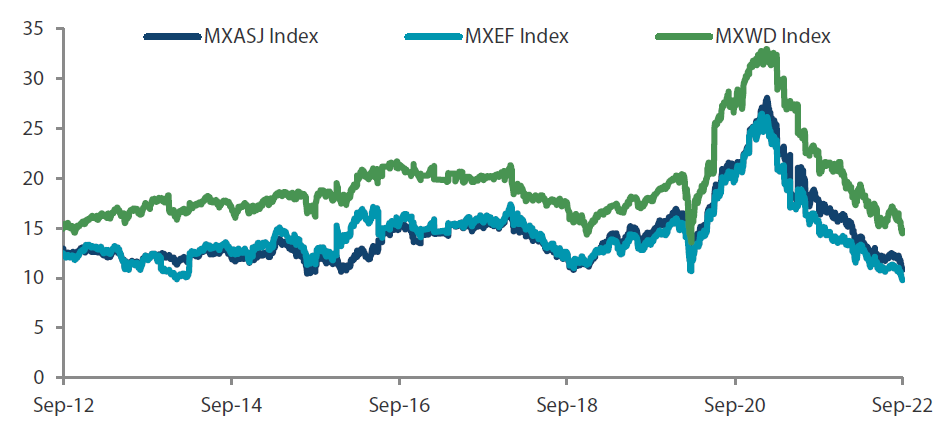
- Markets remain wary of macro concerns including higher rates, geopolitical conflict and recessionary concerns. While we would not attempt to forecast the outcome or timing of these events, we point out that in Asia, a significant amount of concern is already reflected in valuations which are close to crisis level lows. For Asia, the most significant upcoming event is China’s 20th National Party Congress on 16 October. After the congress, we will have a clearer picture of the key decision makers for at least the next five years in the world’s second largest economy. We believe that China policy is key to the region’s future market direction.
Market review
Inflation and rising rates continue to weigh on the markets
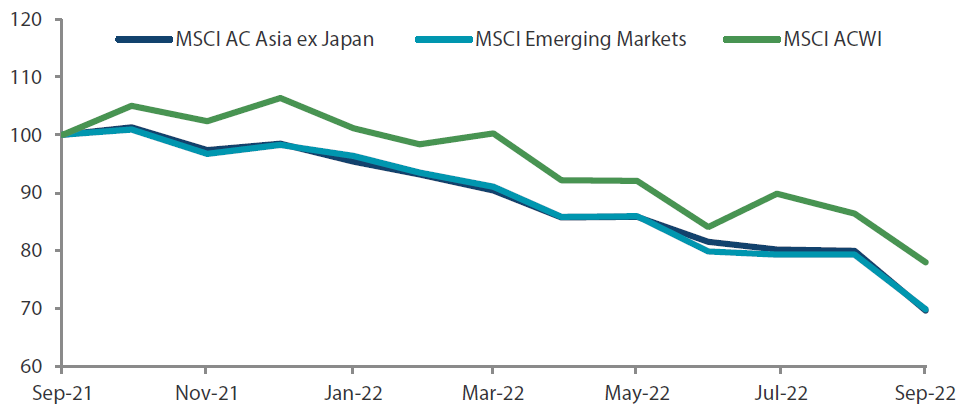
The MSCI AC Asia ex Japan Index lost 12.6% in US dollar (USD) terms in September, as rising interest rates and inflation woes continued to weigh on the regional and global markets. US consumer prices registered above expectations with August’s CPI jumping 8.3% YoY. The tight labour market made further case for a rate hike, culminating in a 75 bps interest rate hike by the Fed. Asian markets were clouded by the negative sentiment from US, with all local markets turning in losses. USD strength against other currencies has also impacted markets.
Chart 1: 1-year market performance of MSCI AC Asia ex Japan versus Emerging Markets versus All Country World Index
 Source: Bloomberg, 30 September 2022. Returns are in USD. Past performance is not necessarily indicative of future performance.
Chart 2: MSCI AC Asia ex Japan versus Emerging Markets versus All Country World Index price-to-earnings
 Source: Bloomberg, 30 September 2022. Returns are in USD. Past performance is not necessarily indicative of future performance.
Higher rates in Hong Kong, South Korea and Taiwan
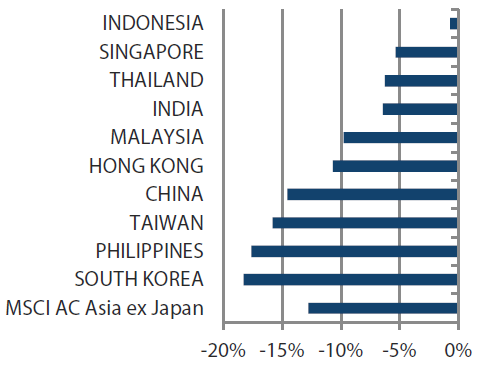
In the North Asian region, China plunged 14.6% (in USD terms) as the Chinese yuan depreciated. The People’s Bank of China reacted by keeping benchmark lending rates unchanged as opposed to reducing rates and slashed the amount of foreign exchange reserves that financial institutions must hold. On a positive note, China’s industrial output and retail sales grew by 4.2% YoY and 5.4% YoY in August. To maintain this momentum, China will speed up fund injections to expedite project construction and boost domestic consumption. Hong Kong (-10.7%) meanwhile, opted to increase rates by 12.5 bps and relaxed mortgage stress test requirements for property buyers. In a sign of reopening, Hong Kong cancelled hotel quarantine requirements for all arrivals.
South Korea plummeted 18.3% despite easing inflationary pressures. The South Korean market fell as the Bank of Korea may be prompted to raise rates with central banks in the US and other developed markets continuing to tighten, the South Korean won weakened and as the country’s unemployment rate reached a new low in August. Taiwan fell 15.8%, as the central bank increased policy rates by 12.5 bps and revised down economic growth forecasts for 2022 and 2023.
ASEAN countries also raise rates but perform better than their North Asian counterparts
The ASEAN region fared slightly better on the whole relative to North Asia; most of the countries within the region raised rates. Thailand (-6.3%) and Malaysia (-9.8%) hiked rates by 25 bps, although both countries expressed confidence in the recovery of their economies. Meanwhile, Indonesia (-0.7%) and the Philippines (-17.6%) raised rates by 50 bps. Indonesia’s annual core inflation hit 3.04% in August, and the International Monetary Fund revised down the Philippines’ economic growth outlook for 2022. In Singapore (-5.3%), an increase in prices of food and services pushed up the August core inflation rate to 5.1% YoY.
Higher food prices in India push up inflation
India (-6.4%) saw its annual retail inflation rate reach 7% in August, driven by a surge in food prices. To combat rising costs, the Reserve Bank of India rates raised its benchmark repurchase rate by 50 bps. India also curbed exports of several varieties of rice to tame local prices, and households were offered cash and subsidies. India’s banking system liquidity slipped into a deficit for the first time in over three years, squeezed by advance tax payments and ballooning government cash balances.
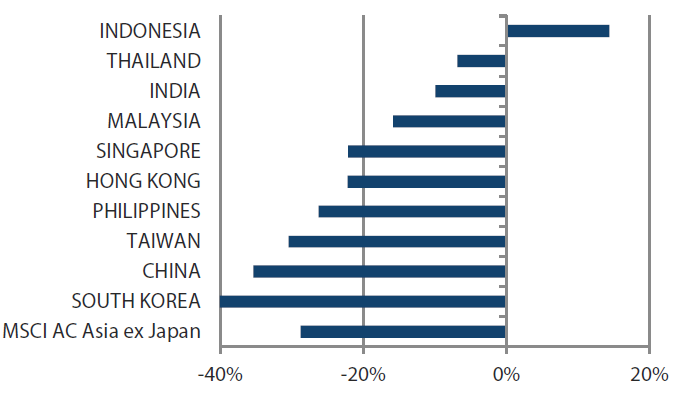
Chart 3: MSCI AC Asia ex Japan Index1
| For the month ending 30 September 2022 | For the year ending 30 September 2022 | |
|
|
Source: Bloomberg, 30 September 2022.
1Note: Equity returns refer to MSCI indices quoted in USD. Returns are based on historical prices. Past performance is not necessarily indicative of future performance.
Market outlook
Muted market sentiment amidst rising interest rates
Markets remain nervous globally owing to a combination of sharply higher rates, escalating geopolitical conflict and recessionary concerns weighing on sentiment. While we would not attempt to forecast the outcome or timing of these events, we point out that in Asia, a significant amount of concern is already reflected in valuations which are close to crisis level lows. For Asia, the most significant upcoming event is China’s 20th National Party Congress on 16 October. After the congress, we will have a clearer picture of the key decision makers for at least the next five years in the world’s second largest economy.
Market focusing on China’s COVID-19 exit strategy
While we are unlikely to see any meaningful policy changes immediately after the congress, we are expecting more clarity on China’s COVID-19 exit strategy and more economic support initiatives as key decision-making resumes over time. These are well-needed, as confidence and activity levels in the hugely important property sector are at extreme lows and evidence of financial strain grows. There are multiple levers authorities can pull to add further support but for political reasons, they have so far refrained from doing so. The areas aligned with authorities’ long-term strategic goals are viewed positively, specifically in areas advancing consumption, improving the cost of living, self-sufficiency and energy security.
Elsewhere in North Asia, we believe the sentiment towards export and hardware technology heavy markets of South Korea and Taiwan are comparatively more muted. While markets are starting to price in some demand risk to consumer-orientated technology, we do not see any material-positive fundamental changes on the horizon and thus retain select positions mainly in areas of healthcare and energy infrastructure build-out.
The positive attractions of India and ASEAN
India and ASEAN’s advantages of young, relatively cheap and in some cases well-skilled workforces have been re-emphasised as multi-national corporations globally look to diversify their supply chains away from a high reliance on China. This, together with positive reforms and targeted subsidies, are resulting in strong FDI inflows for a number of these countries. In addition, the terms of trade shock resulting from Russia’s invasion of Ukraine continues to provide support for markets such as Indonesia which for now look to be re-investing these windfalls into more longer-term growth opportunities. While some of these fundamental changes are becoming better reflected in valuations and positioning, we continue to like areas such as banks, renewable and electric vehicle materials and consumption.
Chart 4: MSCI AC Asia ex Japan price-to-earnings
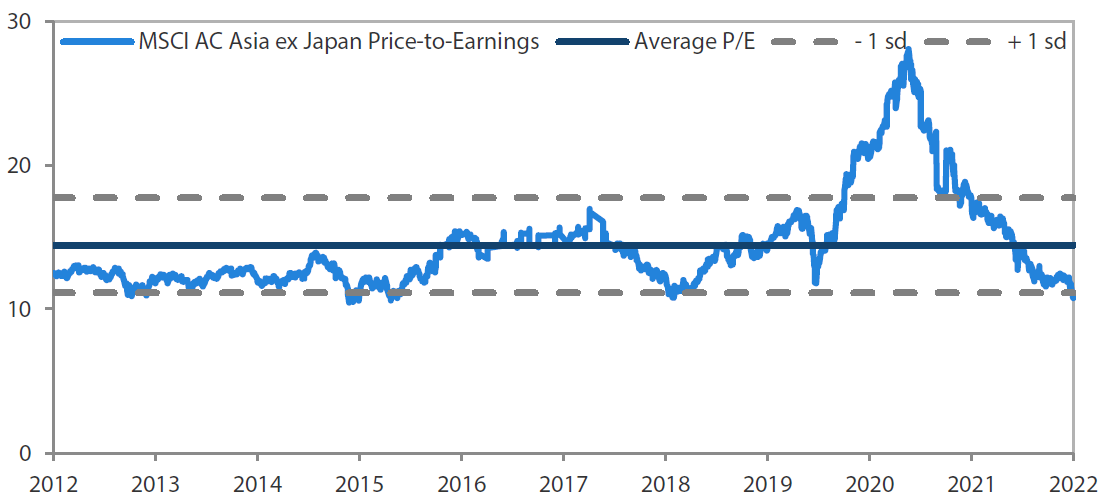
Source: Bloomberg, 30 September 2022. Ratios are computed in USD. The horizontal lines represent the average (the middle line) and one standard deviation on either side of this average for the period shown. Past performance is not necessarily indicative of future performance.
Chart 5: MSCI AC Asia ex Japan price-to-book
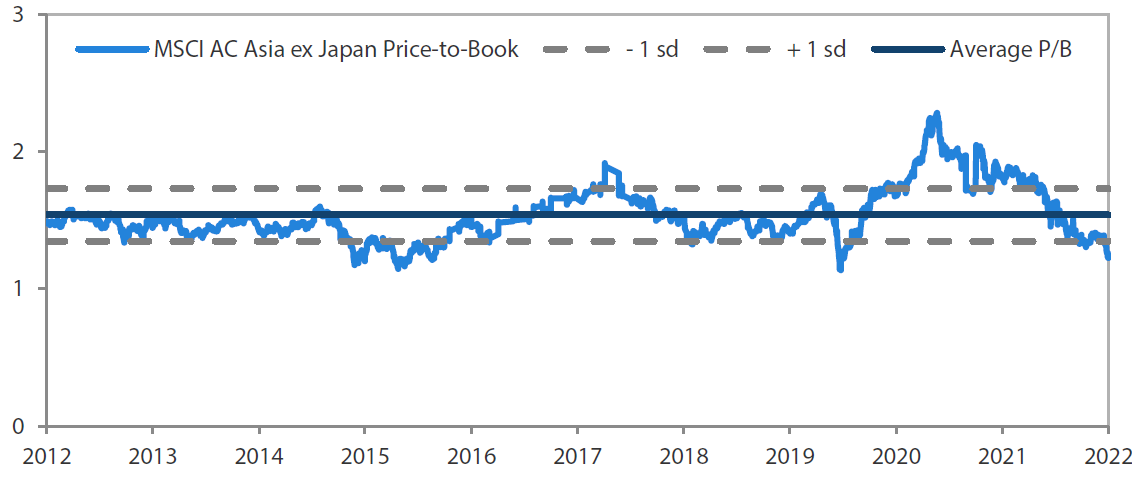
Source: Bloomberg, 30 September 2022. Ratios are computed in USD. The horizontal lines represent the average (the middle line) and one standard deviation on either side of this average for the period shown. Past performance is not necessarily indicative of future performance.


