Snapshot
The positive surprise from the slower-than-expected rise in October US inflation appeared to be a key catalyst for what so far looks like a firm break in dollar momentum. Subsequently, the dollar index (DXY) has fallen more than 5% over the month. No, we are not expecting the US Federal Reserve (Fed) to pivot any time soon towards easing policy. But perhaps it reflects a bit of a shift in the relative growth story which had favoured the US towards one focused on the rest of the world centred around improving China demand. China this month has taken definitive steps to ease its zero-COVID policy while continuing to stimulate its economy. We believe this supports an improved view of China relative to the US, which could experience slowing growth.
Interestingly, US equities have begun to underperform the rest of the world, which in our view is consistent with dollar weakness and inherently self-reinforcing if/when flows start to follow what is perceived to be better opportunities abroad. Cloudy earnings picture ahead amid declining demand is seen as a headwind for US equities, which may support the shift in flows. We are not quite there, but we believe this is a key dynamic to follow in the months ahead.
While some leading indicators do suggest the US is due for a slowdown, evidence from a comprehensive set of hard data still appears to be lacking. Weakness ahead is nevertheless likely, in our view, with the question being “how much?” We still believe that the US private sector is reasonably healthy with strong balance sheets, meaning that a deeper recession seems unlikely. The rest of the world may not escape the headwinds of weaker US demand. But the balance—that is, the overall picture including better demand from China—does reveal interesting opportunities, particularly given fairly broad-based attractive valuations. This shifting dynamic does offer hope, but it also requires an abundance of caution as the contours of a US slowdown are yet to be fully understood.
Cross-asset 1
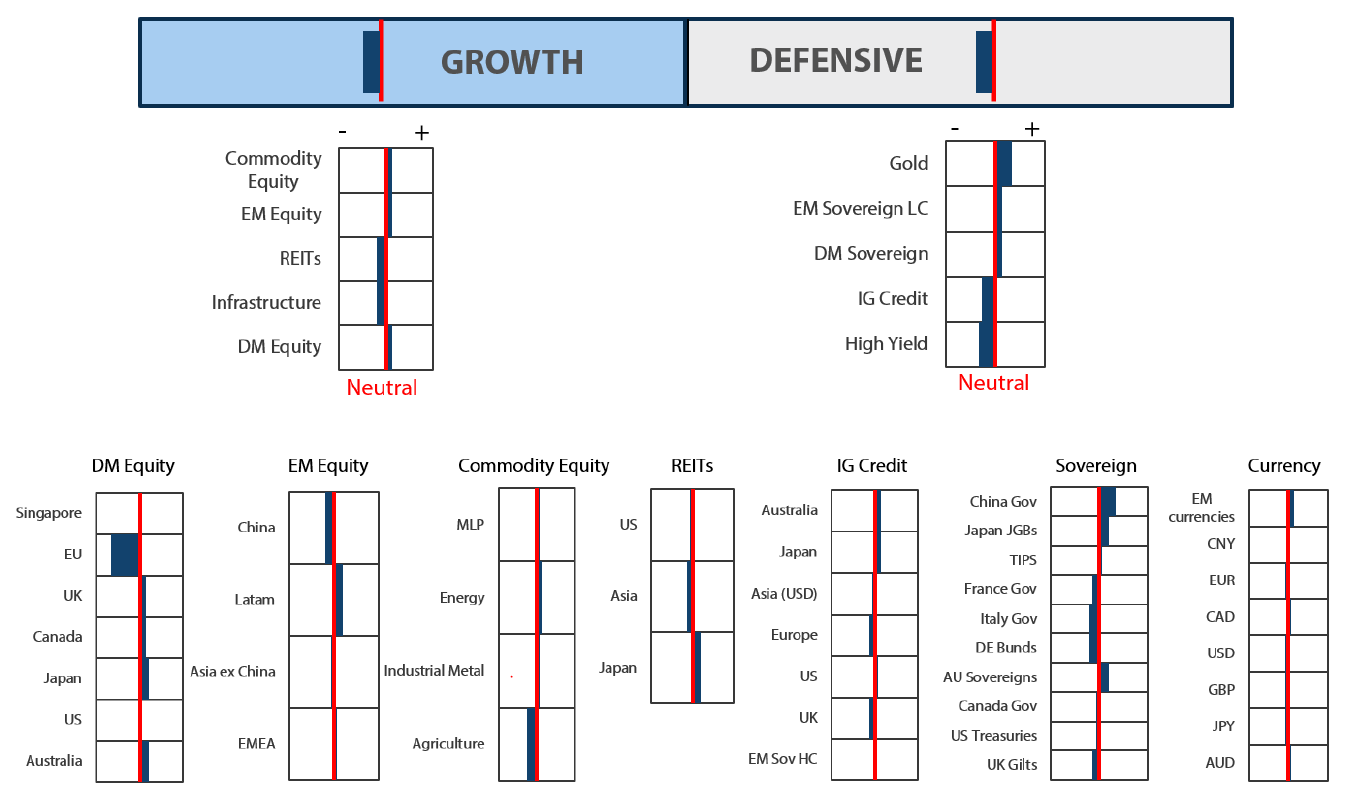
We marginally reduced our underweight to growth assets to the same score as defensive assets, which we maintain at the same weight. The relief rally continued across equities and defensives, but most of such gains were realised in a single day when the October US inflation reading showed a positive surprise to the downside. Has inflation finally peaked? It may peak soon, but a single datapoint is unlikely to change the Fed’s resolve to continue tightening—albeit, at a slower pace.
While we see a case for the relief rally to continue mainly for favourable seasonality, weaker growth is likely to bring down earnings and test US equities in 2023, while US Treasury 10-year yields below 3.5% look stretched given market pricing of a 5.00% terminal rate by mid-2023. But this may be foretelling of weaker growth ahead. Overall, our long-term outlook has not changed much with respect to US equities, but we do see opportunities opening up for the rest of the world as we approach (or have passed) peak dollar and China prepares to open its economy—albeit on a bumpy course in doing so.
Within equities, we increased developed market (DM) equities to overweight, focused on opportunities outside the US, funded again from the reduction to a larger underweight for both Infrastructure and REITs that have remained more volatile since October. We decreased DM sovereigns for stretched valuations in light of policy and added mainly For sophisticated investors only • en.nikkoam.com 2 to emerging market (EM) local currency bonds that naturally benefit from a weaker dollar; we also added to gold, which already has a large overweight.
1The Multi Asset team’s cross-asset views are expressed at three different levels: (1) growth versus defensive, (2) cross asset within growth and defensive assets, and (3) relative asset views within each asset class. These levels describe our research and intuition that asset classes behave similarly or disparately in predictable ways, such that cross-asset scoring makes sense and ultimately leads to more deliberate and robust portfolio construction.
Asset Class Hierarchy (Team View2)

2The asset classes or sectors mentioned herein are a reflection of the portfolio manager’s current view of the investment strategies taken on behalf of the portfolio managed. The research framework is divided into 3 levels of analysis. The scores presented reflect the team’s view of each asset relative to others in its asset class. Scores within each asset class will average to neutral, with the exception of Commodity. These comments should not be constituted as an investment research or recommendation advice. Any prediction, projection or forecast on sectors, the economy and/or the market trends is not necessarily indicative of their future state or likely performances.
Research views
Growth assets
We believe that US monetary policy is clearly the most important factor when assessing the contours of the global growth outlook. But what is nearly as important, in our view, is China’s policy and demand. For three years, demand in the country has been virtually crippled from a confluence of zero tolerance to COVID and still tight policies levelled at the property, and to some extent the tech, sectors. But the tides look to be turning as China shifts away from its zero-COVID policy.
The journey to a full economic reopening is likely to be difficult for China with question marks still hanging on the capacity of its healthcare system. But if the rest of the world can be used as a guide, China could be able to get through it without significant systemic stress. Buttressed with further support for the property sector and broad-based easing, China demand is expected to improve.
China policymakers may have been taking a cautious approach in their COVID policies while growth from exports were supportive. However, with the recent decline in exports coupled with civil unrest which emerged in the wake of the latest round of lockdowns, the policymakers rationally opted to pivot their policies. As China’s rhetoric has shifted—the latest coronavirus strain is now seen as equivalent to the common flu—it may be difficult to turn back. At the same time, while firm support after a prolonged drought may not fix the property sector, it could at least help prop up a sector that has been reeling from aggressive and prolonged efforts to fully dampen speculation.
We believe that these developments coupled with easing dollar strength bode well for global demand, while being fully aware that the flip side is weakening demand from the US. Tight US monetary policy is beginning to take effect in terms of slowing demand, but the flood of money was vast while private sector balance sheets remain strong. So on balance, it appears that the US can navigate a slowdown without inflicting significant pain on global demand. Still, this is the most critical watch point for 2023, in our view.
Opportunities in China and beyond
We still think US equities are priced richly considering that earnings are likely to moderate. But the rest of the world, which has been pressured by a strong dollar, may see some relief in the months ahead. Of course, the tail (US equities) does have the tendency to wag the dog (global equities) in terms of driving global risk sentiment, but these are the early days of China’s policy pivot so it could take time for this theme to evolve and gather stronger conviction.
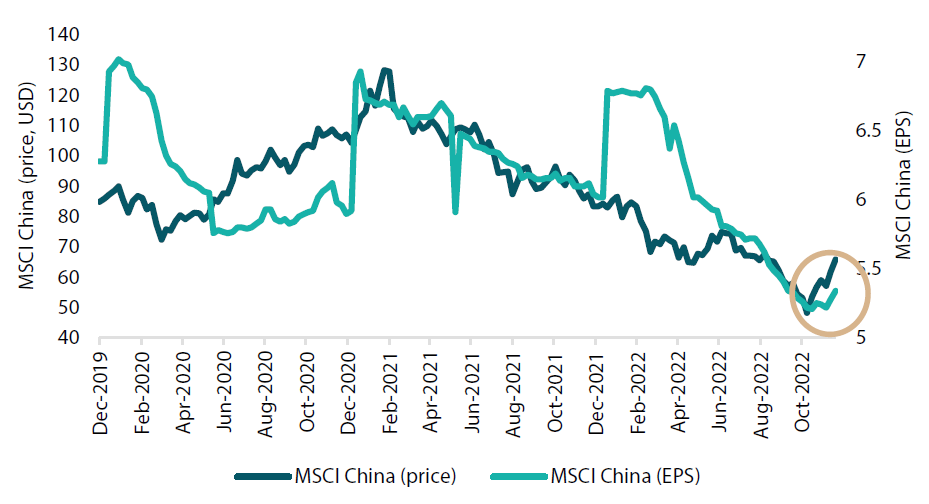
China equities have been in an extreme bear market, declining more than 60% from their February 2021 peak to a trough in late October 2022. The causes for the plunge included policy crackdowns on property and tech, ongoing tit-for-tat trade war with the US and China’s zero tolerance approach towards COVID. Earnings estimates were likewise punished, with early calendar hopes for earnings recovery dashed by the aforementioned factors. Given China’s shift in both COVID and property sector policies and the seeming reprieve in US-Sino tensions following the recent Biden-Xi summit, the relief in price and earnings estimates seems justified.
Chart 1: MSCI China price versus earnings per share (EPS)

Source: Bloomberg, as at 9 December 2022
We believe it would be fair to stay cautious on China for the many risks that remain to be fully resolved. However, considering that earnings estimates have already been downgraded by more than 20% while forward P/E stands at just 12, the risk-reward dynamic appears favourable. Earnings appear to be bottoming while the S&P 500 is still just in the early stages of pricing a decline in earnings where the forward P/E still stands at 18. Keep in mind that China is easing while the US is still tightening monetary policy.
China equities may be attractive but just as important is improving China demand, which paints a more optimistic picture for global assets from Asia to broader EM and even Europe, though there are other headwinds to keep in mind. The key to this China demand theme fully coming to fruition, in our view, is a stable to weaker dollar and Beijing adhering to its pro-growth policies while hopefully averting some of the predicted headwinds, such as an overwhelmed healthcare system. We think that the China demand theme can come into fruition, but of course these aforementioned risks bear watching closely.
Conviction views on growth assets
- European hope: We have a negative view on European assets because of the energy crisis and a challenging road to policy normalisation the region faces. While these two headwinds remain, German and French equity markets clearly seem to hold pockets of opportunity with prospects of returning China demand. We also see a potential shift in geopolitical thinking surrounding the Russia-Ukraine war where support to end the conflict may be building, which would be a potential tailwind for European assets.
- Still constructive on commodities: Energy has taken a beating as of late—likely due to fears of a US slowdown. However, supply-demand dynamics have not changed much and the prospect for improving China demand could certainly tip the scales to support increasing demand. Nevertheless, the energy complex still trades at a significant discount to broader equities, making risk-return dynamics still attractive. We also like metals and mining for improving demand from China.
- Emerging markets: The shift in China policy and a weaker dollar is a firm positive for the rest of Asia and EM. It is also more broadly positive for commodities demand and host of beneficiaries of released pent-up demand, such as in travel in which Thailand is a favoured destination.
- Past peak dollar: We have been cautious on calling peak dollar, but we feel it has already happened or will soon take place. Growth trends are seemingly shifting from east to west, helping to sustain this dynamic as capital follows growth.
Defensive assets
Our cautious view on sovereign bonds remains unchanged. The recent rally in sovereign bonds has gone against the message from central banks of more monetary policy tightening to come. Speculation that peak inflation has arrived prompted markets to look beyond central bank terminal rates and price in the next easing cycle. However, we expect inflation to be a stubborn foe for central banks and more tightening remains a risk.
Global investment grade credit has rebounded strongly through a combination of tighter spreads and falling government benchmark yields. A weaker-than-expected US inflation reading set off a round of optimism that price pressures may be peaking and that central banks may not deliver on the scale of rate hikes implied by market pricing. While this would certainly be positive for sentiment, the tightening of credit conditions is still underway and slower growth is seen as a headwind for credit quality.
Gold has rebounded in US dollar terms after the surge in real yields and the dollar abated. Central banks appear set to slow down their tightening pace and dollar strength has peaked as a result. Gold is also seen to be benefiting from ongoing efforts by governments to increase the diversification of their foreign exchange (FX) reserves.
Mixed fortunes for currency hedging
The enormity of the global markets provides investors with numerous opportunities to seek potential returns and diversity that are simply not available in their home markets. However, investing outside local markets also introduces FX risk, leading to an age-old question: To hedge or not to hedge? The answer is often split along the bond/equity line, with FX hedging more prominent among fixed income investors.
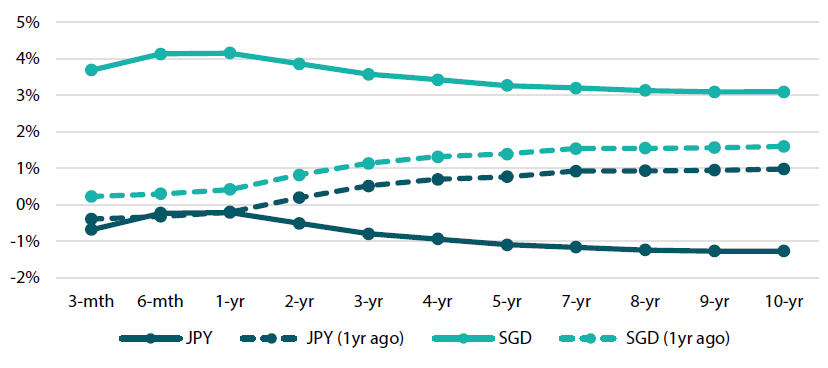
When considering the merits of investing in a foreign bond, we often must consider not only the yield on offer but also the associated FX hedging costs. Chart 2 shows US Treasury yield curves that have been adjusted for the impact of FX hedging from the perspective of Japanese yen (JPY) and Singapore dollar (SGD) investors. We are showing both the current “hedged” yields and the same from a year ago for each currency.
Chart 2: FX-hedged US Treasury yield curves

Source: Bloomberg, as at 13 December 2022
First the good news: SGD investors have enjoyed a positive yield, or carry, from investing in US Treasury bonds across the yield curve for at least the last 12 months. With similar short rates and yield curve shapes between Singapore and the US, FX hedging costs have been a relatively minor concern. This stands in sharp contrast to JPY investors who have seen a significant change in their hedged yields. A year ago, most of the US yield curve offered a positive carry of up to 1%. But fast forward to today and JPY investors now have a significantly negative carry of over -1% for 10-year US Treasuries.
Once again in contrast to Singapore, US cash rates and its yield curve have diverged massively from Japanese rates. Last year, the cash rate differential was a mere 25 basis points (bps) but now stands at over 400 bps, and the US yield curve between 2-year and 10-year maturities is now steeply inverse while Japan’s yield curve is still positively shaped. The combination of these changes has left JPY investors with a serious carry problem when investing in US Treasuries and other foreign bonds.
When foreign yield curves are normally shaped and steep, hedged yields can be attractive as hedging costs are generally based on short-term rates for investment in longer-term rates. However, this is usually not locked in for the life of the bond and so the hedged yield is likely to fluctuate; furthermore, as we have seen, it can turn negative. Unfortunately, there is no free lunch when investing in hedged foreign bonds with positive carry. Over time, we expect the hedged yield on foreign sovereign bonds to become similar to those of equivalent maturities in the local bond markets. This of course also depends on the relative credit quality of the foreign issuers and so some sovereign bonds may provide better hedged returns than others.
Conviction views on defensive assets
- EM sovereigns: EM central banks have remained well ahead of developed market peers in terms of lifting rates, making EM real yields attractive alongside a weaker dollar that provides some relief from inflation pressures.
- Prefer sovereigns over credit: As global monetary policy tightening translates to slower global growth, pressures are likely to mount on corporate credit quality and spreads can continue to widen.
- Gold may continue to perform: Gold may prove to be an inexpensive hedge against rising geopolitical risk and sticky inflation while waning dollar strength turns a headwind into a tailwind.
Process
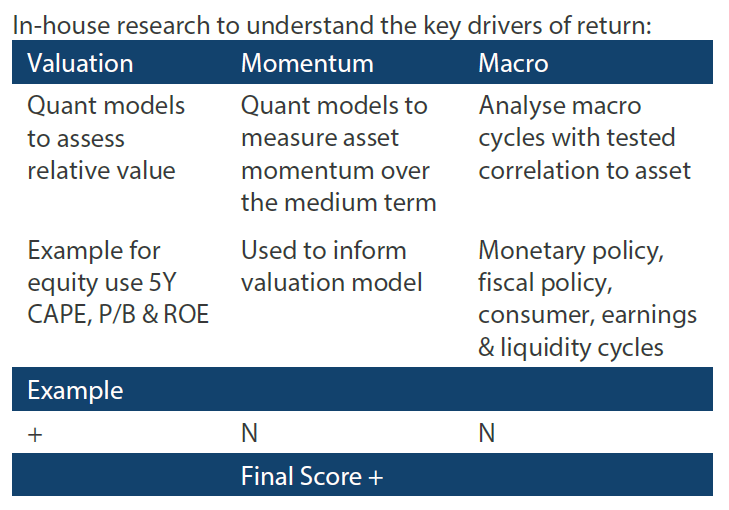
In-house research to understand the key drivers of return:


