


Summary
- The Indian market remains attractive. It has the highest earnings growth in the Asian region, valuations that are in the middle of its historic range and an economy that is growing strongly with inflation under control.
- The equity markets of the two largest economies in the world continue to head in opposite directions. The US market is on the up, led by technology stocks and a supportive economic backdrop. Meanwhile, Chinese equity markets continue to fall, weighed by a prolonged property bust, piecemeal policy responses and continued regulations on industries. However, there are still a large number of Chinese companies with very attractive growth profiles that are being penalised by the country risk.
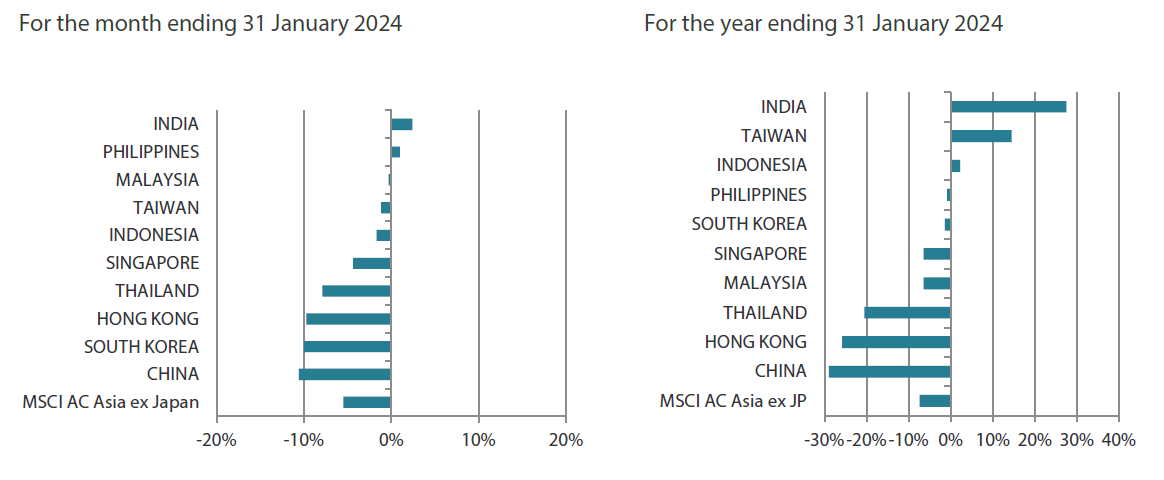
- For the month, the MSCI AC Asia ex Japan Index declined 5.5% in US dollar (USD) terms. While the US Federal Reserve (Fed) left interest rates steady, it indicated that cuts to interest rates likely are not imminent, dashing hopes for a March rate cut. China remains a drag on the region’s performance despite Beijing’s continued efforts to stimulate the economy.
- India (+2.4%) and the Philippines (+1.0%) grinded out gains in January, while the rest of the region was in the red. China (-10.6%), South Korea (-10.0%) and Hong Kong (-9.7%) were the biggest laggards.
Market review
Asian markets largely fall in January
Asian markets mostly fell in January, with the MSCI Asia Ex Japan Index snapping a two-month winning streak (+10% over November and December) and declining 5.5% in US dollar (USD) terms. While the Fed left interest rates steady, it indicated that easing was probably not on the immediate horizon, pouring cold water on the market’s hopes for a March rate cut. China remains a drag on the region’s performance amid a steep selloff in Chinese markets, despite Beijing putting into place several measures to boost market confidence.
Chart 1: 1-yr market performance of MSCI AC Asia ex Japan vs. Emerging Markets vs. All Country World Index
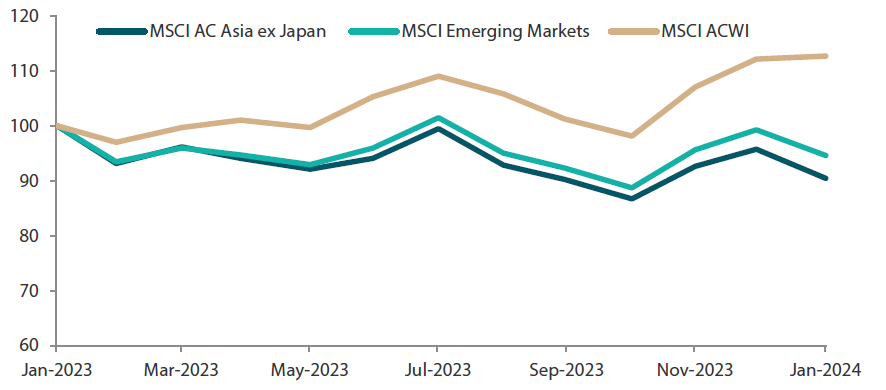
Source: Bloomberg, 31 January 2024. Returns are in USD. Past performance is not necessarily indicative of future performance.
Chart 2: MSCI AC Asia ex Japan versus Emerging Markets versus All Country World Index price-to-earnings
Source: Bloomberg, 31 January 2024. Returns are in USD. Past performance is not necessarily indicative of future performance.
China shares remain under pressure
In North Asia, China and Hong Kong stocks tumbled 10.6% and 9.7%, respectively, in January. Concerns over China’s beleaguered property sector continued to weigh with China Evergrande Group given orders to liquidate by a Hong Kong court. Investors will keep a keen eye on how authorities draw the line between offshore and onshore stakeholders as the liquidation of Evergrande unfolds. Separately, policymakers have stepped in with forceful measures to support China’s sliding stock market, including a 50-basis-point cut to the reserve ratio requirement for banks. Still, the broader economic outlook remains patchy; factory activity contracted for a fourth straight month in January, adding to deflationary pressure in the world’s second largest economy.
South Korean stocks shed 10.0%, weighed down by a slump in the share prices of heavyweight Samsung Electronics which posted a 35% drop in fourth-quarter operating profit. Separately, the Bank of Korea left its policy rate unchanged at 3.50%, and South Korea’s GDP for the fourth quarter expanded 0.6% on a quarterly basis, exceeding market expectations. In Taiwan (-1.2%), the Democratic Progressive Party won a third consecutive presidential victory, fuelling investors’ concerns that tensions with China could rise. Taiwan’s consumer confidence did hit a two-year high in January and its fourth-quarter preliminary GDP was stronger than expected.
ASEAN markets end on a mixed note
The Philippines (+1.0%) led the way within ASEAN. The Philippine fourth-quarter GDP came in at 5.6%, beating expectations and bringing full-year GDP growth for 2023 to 5.6%. Meanwhile, Thailand (-7.9%) lowered its 2024 GDP growth projection to 2.8%, a sharp downgrade from an earlier forecast of 3.2%. Malaysia’s (-0.3%) economic growth likely slowed to 3.8% in 2023 due to lower exports, which slumped 8% for the year. Bank Negara Malaysia left its overnight policy rate unchanged at 3%. Its counterpart in Indonesia (-1.7%) likewise kept the benchmark seven-day reverse repurchase rate at 6% for the third consecutive meeting. In Singapore (-4.4%), the Monetary Authority of Singapore maintained its monetary policy settings for a third straight time amid expectations for inflation to ease only later this year.
India the standout performer of the month
Indian stocks were the best performers for the month, rising 2.4%. The government had forecast economic growth to come in at 7.3% for the fiscal year ending in March, on an increase in private and government expenditure. The Reserve Bank of India stated that it was not considering interest rate cuts yet unless inflation settles firmly around the 4% target. India's annual retail inflation rose to a four-month high of 5.69% in December 2023 from 5.55% the previous month.
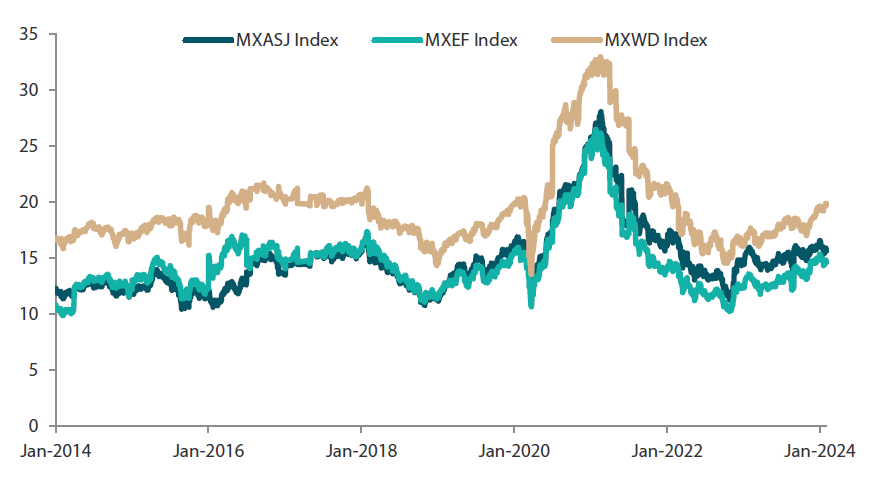
Chart 3: MSCI AC Asia ex Japan Index¹
Source: Bloomberg, 31 January 2024.
Market view
Equity markets of the world’s two biggest economies move in opposite directions
The equity markets of the two largest economies in the world continue to head in opposite directions. The US market is on the up, led by technology stocks and a supportive economic backdrop. The US 10-year bond yield ended the month at 3.9%—signalling that the “Goldilocks scenario” is on track. The US dollar index (DXY) strengthened 1.9%, largely reversing last month's weakness. The US economy remained resilient and inflation was trending lower.
The opposite is almost true in China. Chinese equity markets continue to fall, weighed by a prolonged property bust, piecemeal fiscal and monetary policy responses and continued regulations on industries; all of which is adding up to a growing lack of confidence among investors. On the positive side, there are a large number of Chinese companies with very attractive growth profiles that are being penalised by the country risk. On the external side, there is a risk of a brewing electric vehicle (EV) trade war with Europe. China has created a large manufacturing base for EVs and related industries. The domestic market is not large enough to absorb this, and the US has put up tariff barriers. This leaves Europe as the only market large enough to absorb a lot of the surplus, directly challenging the European auto industry. We will continue to monitor this space.
A lot going for India
The Indian market remains attractive. It has the highest earnings growth in the Asian region, valuations that are in the middle of its historic range and an economy that is growing strongly with inflation under control. In the last five years, the ruling Bharatiya Janata Party government has focused on investing in upgrading India’s infrastructure. We expect fixed asset investments to reap the rewards in the next five years. India is enjoying a “Goldilocks” scenario and has the extra kicker of a supportive political backdrop, unlike the US where politics could be a potential Achilles’ heel. Indian equities are still underrepresented in global portfolios, opening up the possibility of additional foreign inflows this year.
Weak start to the new year for ASEAN markets
The ASEAN markets got off to a weak start this year after a good 2023. A dividend yield of 4.3% compensates for the relatively lower earnings growth. In our view, positive fiscal policy in Malaysia and Indonesia focused on domestic development should also support market sentiment. Singapore remains the bell-weather safe-haven market and falling interest rates should support the financially sensitive index.
Outside of the US and emerging Asia, the broader global market rally continued with the MSCI World (MXWO) rising another 1.1%. The Japanese market continues to make new highs. Tensions in the Middle East are, so far, being downplayed by the broader markets, but crude oil was up 6% on rising risks of a wider military escalation in the Middle East.
Chart 4: MSCI AC Asia ex Japan price-to-earnings
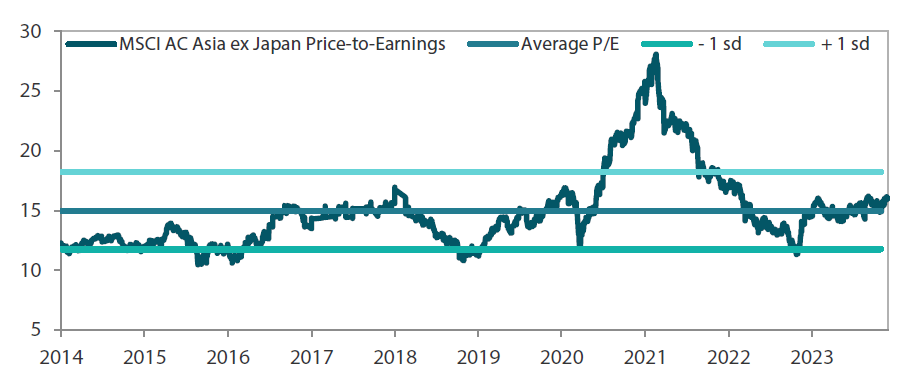
Source: Bloomberg, 31 January 2024. Ratios are computed in USD. The horizontal lines represent the average (the middle line) and one standard deviation on either side of this average for the period shown. Past performance is not necessarily indicative of future performance.
Chart 5: MSCI AC Asia ex Japan price-to-book
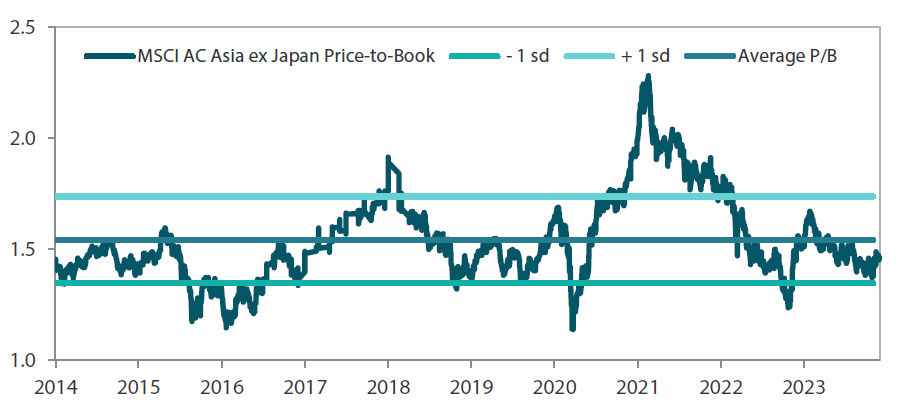
Source: Bloomberg, 31 January 2024. Ratios are computed in USD. The horizontal lines represent the average (the middle line) and one standard deviation on either side of this average for the period shown. Past performance is not necessarily indicative of future performance.
Reference to individual stocks is for illustration purpose only and does not guarantee their continued inclusion in the strategy’s portfolio, nor constitute a recommendation to buy or sell.
1Note: Equity returns refer to MSCI indices quoted in USD. Returns are based on historical prices. Past performance is not necessarily indicative of future performance.
